Logistic regression is a powerful statistical method used for binary classification
problems, where the outcome variable is categorical and can take on two possible values, such as
"pass/fail," "yes/no," or "spam/not spam." Unlike linear regression, which predicts continuous outcomes,
logistic regression estimates the probability of an event occurring, allowing us to make informed
predictions based on the input features.
Why Logistic Regression?
The need for logistic regression arises from the limitations of linear regression when applied to binary
classification tasks. Linear regression attempts to fit a straight line to the data, which can yield
predictions that fall outside the acceptable range of probabilities (0 to 1). Logistic regression, on the
other hand, uses the logistic function (sigmoid function) to map predicted values to probabilities, ensuring
that the output always lies within the [0, 1] range.
Example Problem
Consider a scenario where we want to predict whether students will pass or fail an exam based on the number
of hours they studied. Here, we have a binary outcome (pass/fail) and a continuous input feature (study
hours).
Dataset Description
In our dataset, we have two columns:
- Study Hours: The number of hours a student studied for the exam.
- Pass/Fail: The outcome variable, where "1" indicates a pass and "0" indicates a fail.
Visualizing the Problem
Below is a visualization illustrating the relationship between study hours and the probability of passing
the exam. While a linear model might suggest a direct line, a logistic regression curve accurately captures
the probability that a student passes as study hours increase.
0
1
2
3
4
5
6
7
8
Pass
Fail
Study Hours
Pass/Fail Result
Since we know that this time we have discrete and fixed prediction range . Can we say that we can limit
the eqn so that it will work properly in discrete range..
Think of it like suppose if someone mistakenly feed that i had read -4 hours (which might not be
correct) but this will lead to a region of negative quadrant due to which my output leads to some
negative range which is not correct.
Logistic Regression Visualization
This graph illustrates how the probability of passing the exam changes based on the number of hours
studied.
The Y-axis represents the probability of passing, while the X-axis shows the study hours. The logistic
regression curve is drawn using the sigmoid function.
Explanation
Y-axis (Probability): The probability that a student passes the exam. The value
ranges
from 0 to 1.
X-axis (Study Hours): Represents the number of study hours, which is the feature
variable.
Sigmoid Curve: Shows the probability as study hours increase. The curve fits the
data in
a way that guarantees a value between 0 and 1.
To Ensure that prediction will be discrete. We have to Squash the linear equation (y = mx+c) by using
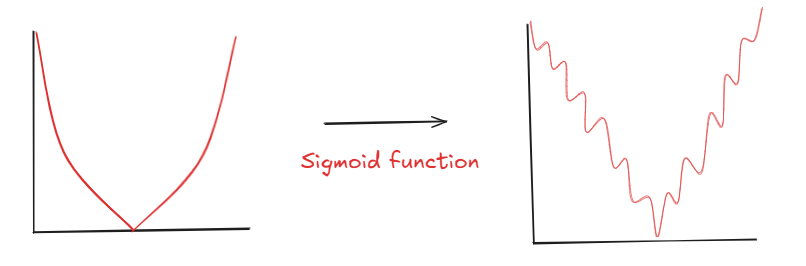
sigmoid function as it use exponential function and ensure that the range of function lies either 1 or 0.
Sigmoid Function: \( \sigma(x) = \frac{1}{1 + e^{-x}} \)
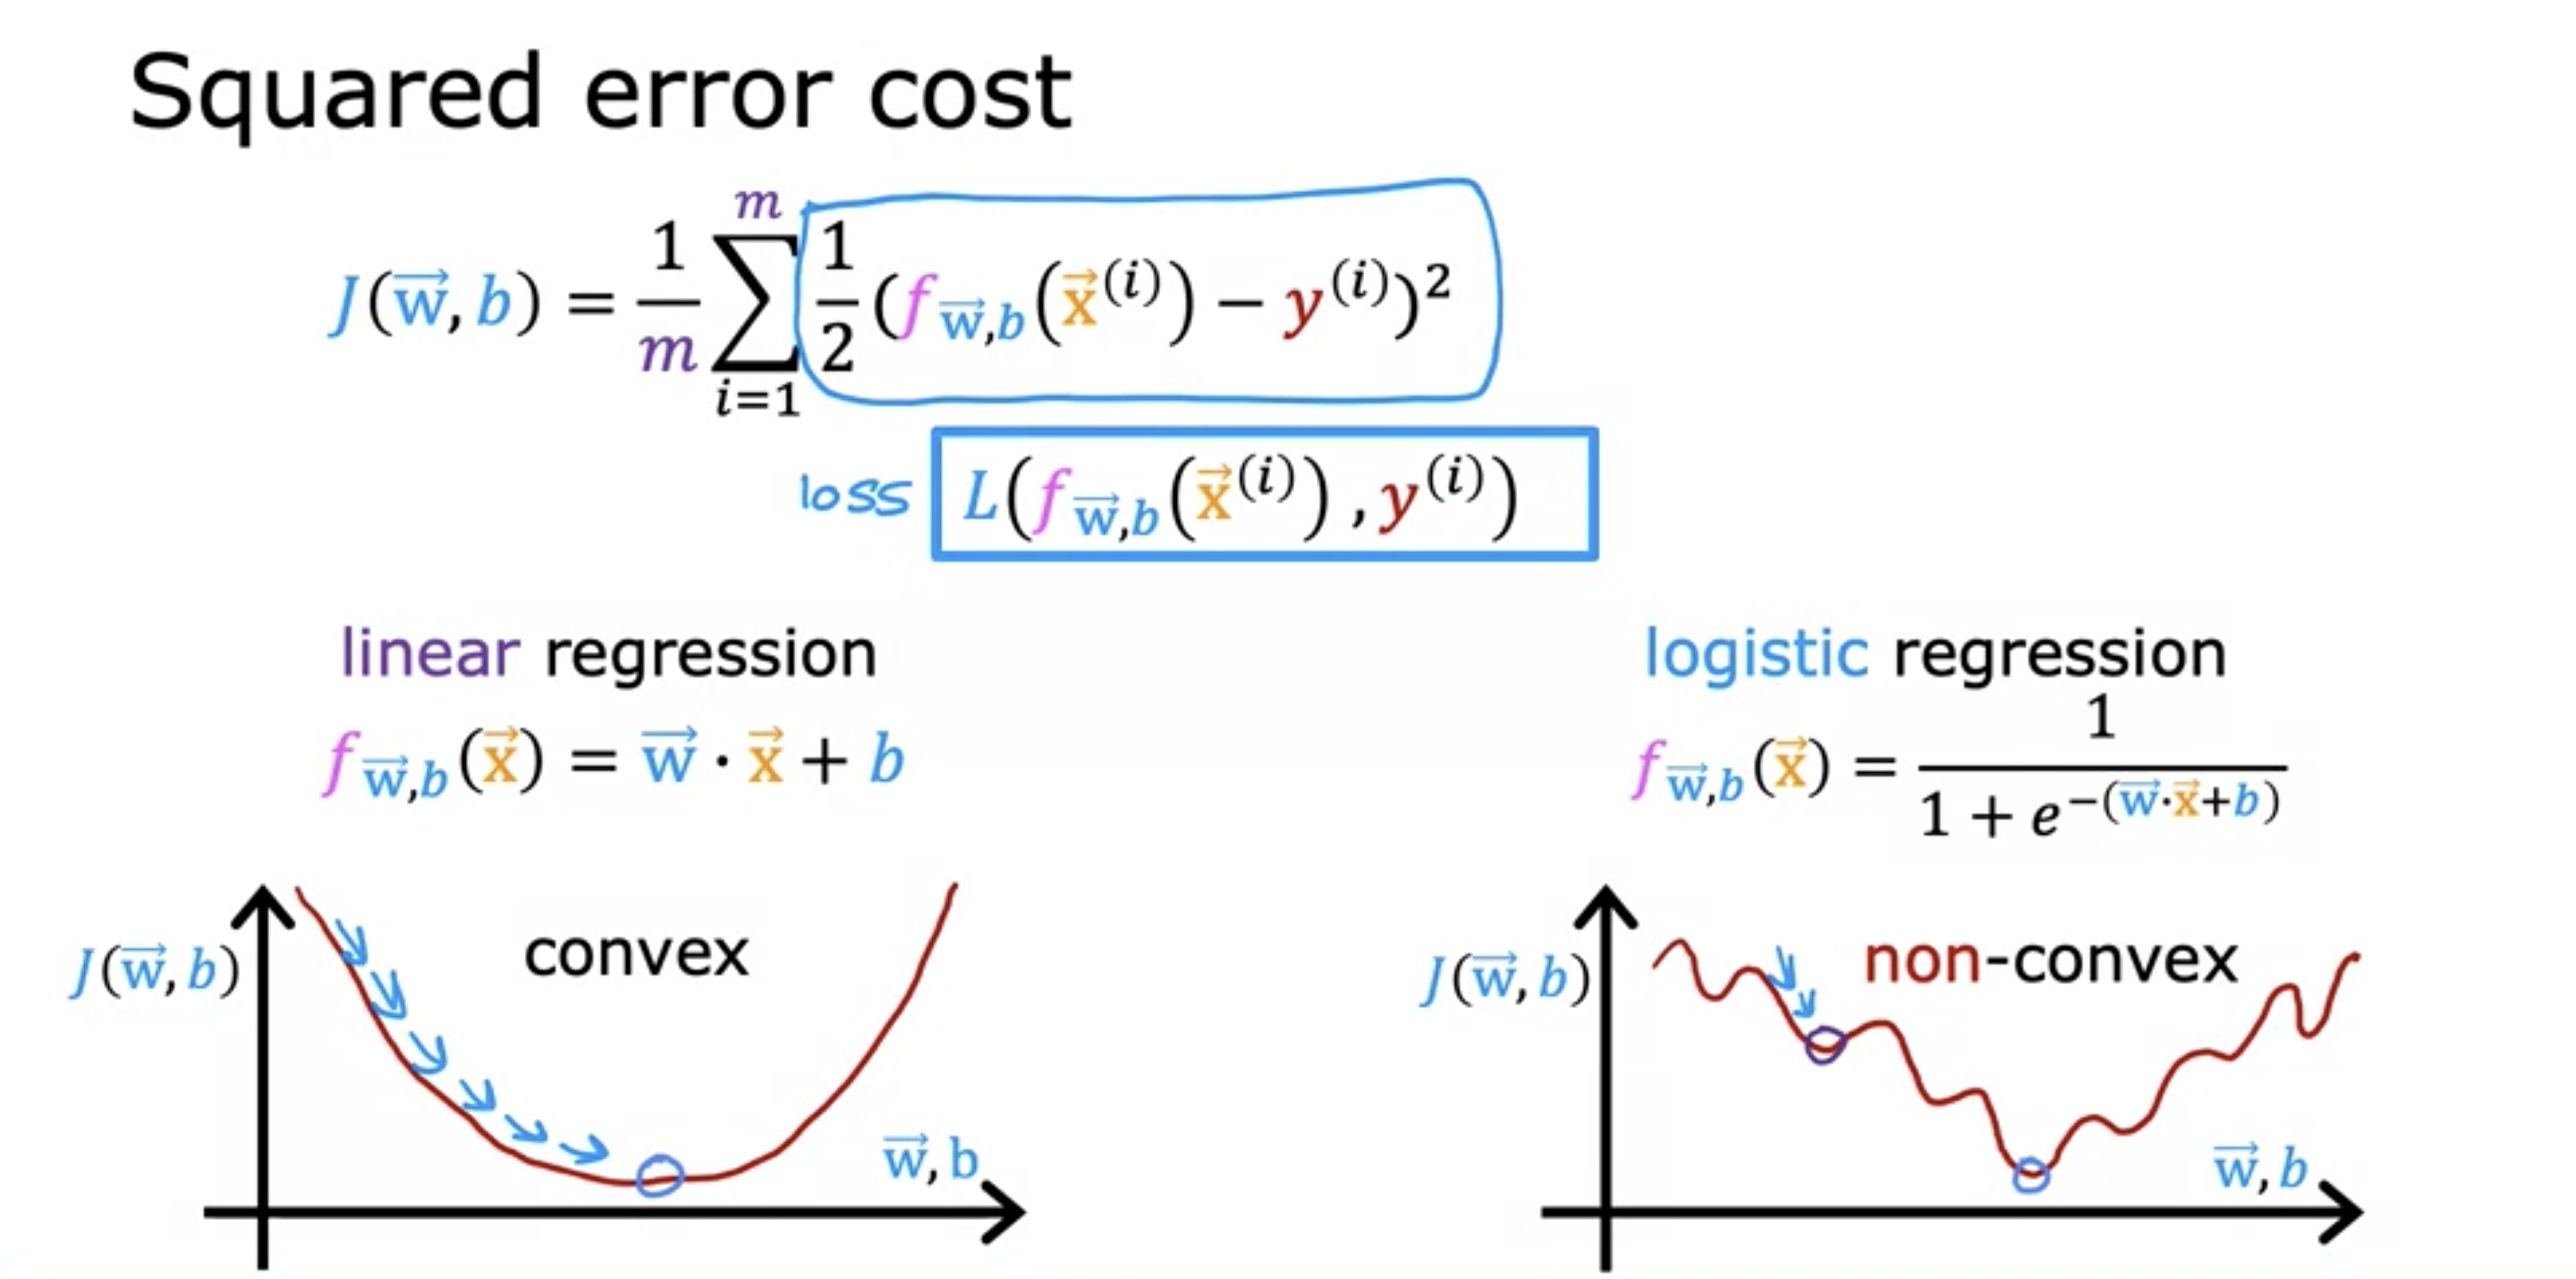
Due to presence of sigmoid function, Convex property of the differentiable function looses.
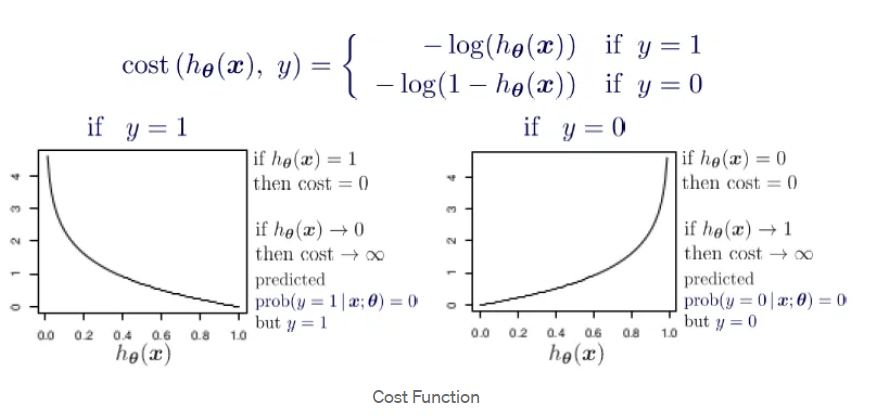
To maintain the convex property of the function we modified the cost function to ensure that it will
maintain its convexity.